
Back to: Robotics & Artificial Intelligence (Class X)
What is a Module?
A Module is simply a Python file (.py) that contains functions, variables, or classes which we can reuse.
Why Use Modules?
- Saves time
- Avoids rewriting code
- Organizes programs
Create a file named math_tools.py
def add(a, b):
    return a + b

def sub(a, b):
    return a - b
Now use it in another file:
import math_tools

print(math_tools.add(5, 3))
print(math_tools.sub(10, 4))
What is a Package?
A Package is a folder that contains multiple modules.
myPackage/
   __init__.py
   calc.py
   greet.py
Use package:
from myPackage import calc
print(calc.add(2,3))
Library
What is a Library?
A Library is a collection of many packages and modules created by developers for specific tasks like math, data analysis, graphs, etc.
Example Libraries:
- NumPy
- Pandas
- SciPy
- Matplotlib
Matplotlib
Matplotlib is a Python library used to draw graphs and charts. It helps us see data visually instead of only numbers.
Why Do We Use Matplotlib?
Sometimes numbers are hard to understand. Graphs make information clear, fast, and attractive.
What Can Matplotlib Create?
- Line Graph 📈
- Bar Chart 📊
- Pie Chart 🥧
- Scatter Plot
- Histograms
Import Library
import matplotlib.pyplot as pltLine Graph
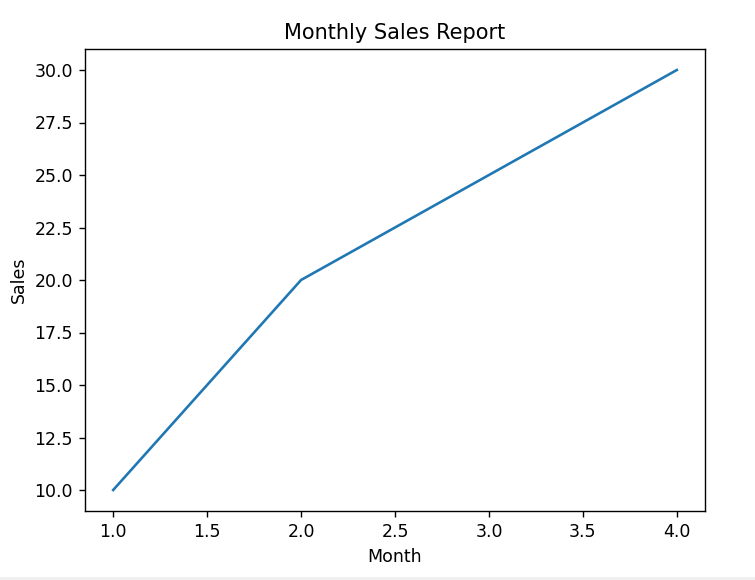
import matplotlib.pyplot as plt
x = [1, 2, 3, 4]
y = [10, 20, 25, 30]

plt.plot(x, y, label="Sales Growth")

plt.xlabel("Month")
plt.ylabel("Sales")
plt.title("Monthly Sales Report")
plt.show()- import → brings graph tools
- x, y → data values
- plot() → draws line
- xlabel / ylabel → axis names
- title() → heading
- show() → display graph
This code creates a simple line graph with proper labels and a title.
Bar Graph
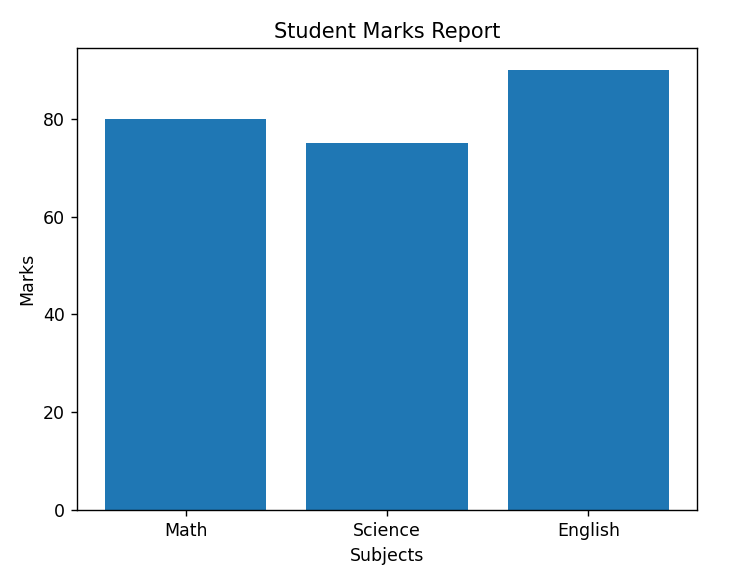
import matplotlib.pyplot as plt

subjects = ["Math", "Science", "English"]
marks = [80, 75, 90]

plt.bar(subjects, marks)

plt.xlabel("Subjects")
plt.ylabel("Marks")
plt.title("Student Marks Report")
plt.show()
- plt.bar(subjects, marks)
Draws the bar chart. - plt.xlabel(“Subjects”)
Name of the bottom (X) axis. - plt.ylabel(“Marks”)
Name of the side (Y) axis. - plt.title(“Student Marks Report”)
Heading shown at the top of the chart. - plt.show()
Displays the bar graph on the screen.
Now the bar chart will look clear, labeled, and professional.
Pie Chart
import matplotlib.pyplot as plt

data = [40, 30, 20, 10]
labels = ["Math", "Science", "English", "Hindi"]

plt.pie(data, labels=labels)
plt.show()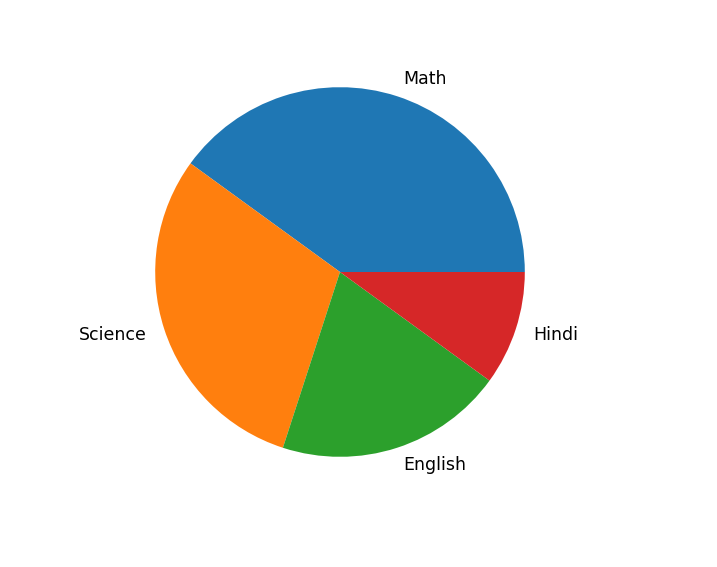
- import → bring graph tool
- data → numbers (slice size)
- labels → names of slices
- pie() → draw pie chart
- show() → display chart
This code visually shows how much each subject contributes out of the total.
Scatter Plot
A Scatter Plot is a graph used to show the relationship between two sets of numbers. It displays points (dots) instead of lines or bars.
import matplotlib.pyplot as plt

x = [1, 2, 3, 4, 5]      # Study Hours
y = [50, 55, 65, 70, 80] # Marks

plt.scatter(x, y)

plt.xlabel("Study Hours")
plt.ylabel("Marks")
plt.title("Study Hours vs Marks")

plt.show()
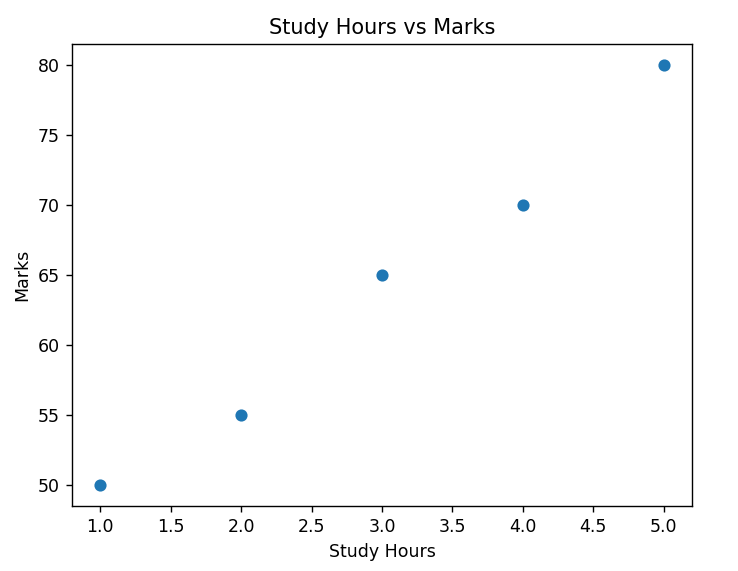
import matplotlib.pyplot as plt
Imports graph library.
x list
Data for X-axis (Study Hours).
y list
Data for Y-axis (Marks).
plt.scatter(x, y)
Draws dots on graph.
xlabel() / ylabel()
Names of axes.
title()
Heading of the graph.
show()
Displays the graph.
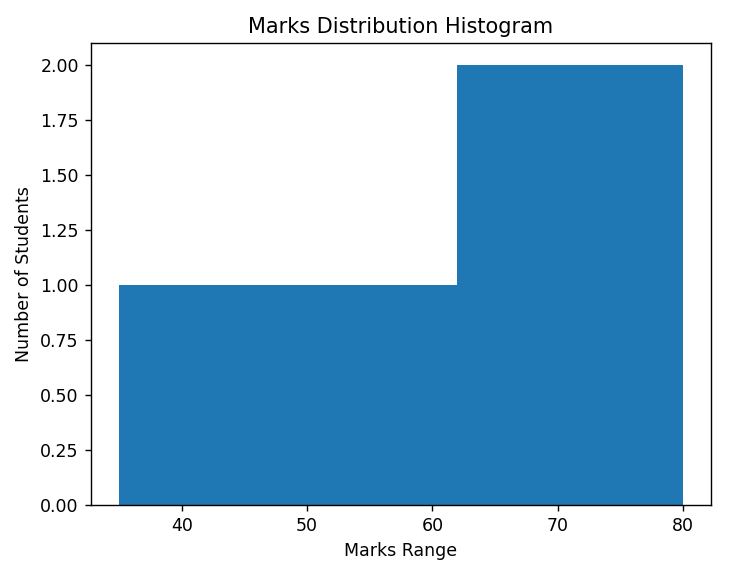
Histogram
A Histogram is a graph used to show the distribution of numerical data. It tells how many values fall into a particular range.
What are Bins?
Bins are ranges or groups in which data is divided.
Example:
Marks of students = 10, 20, 30, 40, 50, 60
If we use 3 bins, Python may divide data like:
- Bin 1: 0 – 20
- Bin 2: 21 – 40
- Bin 3: 41 – 60
Each bin shows how many values fall inside that range.
import matplotlib.pyplot as plt

marks = [35, 45, 55, 65, 70, 75, 80]

plt.hist(marks, bins=5)

plt.xlabel("Marks Range")
plt.ylabel("Number of Students")
plt.title("Marks Distribution Histogram")

plt.show()
- import matplotlib.pyplot as plt
Imports graph library. - marks list
Numerical data to analyze. - plt.hist(marks, bins=5)
hist()creates histogram.bins=5means data is divided into 5 ranges.
- xlabel() → Name of bottom axis.
- ylabel() → Name of side axis.
- title() → Heading of graph.
- show() → Displays graph.
How Histogram Works
Suppose marks are from 35 to 80 and bins = 5.
Matplotlib automatically creates ranges like:
- 35–44
- 45–54
- 55–64
- 65–74
- 75–84
Then it counts how many students fall in each range.
NumPy
NumPy (Numerical Python) is a Python library used for working with numbers and arrays. It is very useful in Data Science, AI, Machine Learning, and Robotics because it makes mathematical calculations fast and easy.
Key Features of NumPy
- Array Object – Similar to lists but faster and more powerful.
- High Performance – Works faster than normal Python lists.
- Mathematical Functions – Supports operations like addition, subtraction, mean, square root, etc.
- Multi-Dimensional Arrays – Can handle 1D, 2D, 3D arrays.
1. Creating Array
import numpy as np

arr = np.array([1, 2, 3, 4])
print(arr)
2. Zeros and Ones
import numpy as np

a = np.zeros(5)   # 5 zeros
b = np.ones(3)    # 3 ones

print(a)
print(b)
import numpy as np → Imports the NumPy library. np is a short name (alias).
np.zeros(5) → Creates an array with 5 zero values.
np.ones(3) → Creates an array with 3 one values.
print(a) and print(b) → Display the arrays on the screen.
[0. 0. 0. 0. 0.]
[1. 1. 1.]
3. Range
import numpy as np

arr = np.arange(1, 10)   # 1 to 9
print(arr)
import numpy as np → Imports the NumPy library with short name np.
np.arange(1, 10) → Creates an array starting from 1 up to 9.
- The first value (1) is included.
- The last value (10) is not included.
print(arr) → Displays the array.
[1 2 3 4 5 6 7 8 9]4.Reshape Array
import numpy as np

arr = np.array([1,2,3,4,5,6])
new_arr = arr.reshape(2,3)

print(new_arr)
np.array([1,2,3,4,5,6]) → Creates a 1-Dimensional array with 6 elements.
reshape(2,3) → Converts it into a 2 rows × 3 columns array.
print(new_arr) → Displays the reshaped array.
[[1 2 3]
 [4 5 6]]
5. Mathematical Operations
import numpy as np

a = np.array([1,2,3])
b = np.array([4,5,6])

print(a + b)   # Addition
print(a * b)   # Multiplication
np.array([1,2,3]) and np.array([4,5,6]) → Create two arrays.
a + b → Adds each element of array a with the corresponding element of array b.
a * b → Multiplies each element of array a with the corresponding element of array b.
This is called Element-wise Operation.
[5 7 9]
[ 4 10 18]
6. Mean, Sum, Max, Min
import numpy as np

arr = np.array([5,10,15,20])

print(np.sum(arr))    # Sum
print(np.mean(arr))   # Average
print(np.max(arr))    # Maximum
print(np.min(arr))    # Minimum
np.array([5,10,15,20]) → Creates an array of numbers.
np.sum(arr) → Adds all values in the array.
np.mean(arr) → Finds the average (mean) value.
np.max(arr) → Finds the largest number.
np.min(arr) → Finds the smallest number.
50
12.5
20
5
- Sum: 5 + 10 + 15 + 20 = 50
- Average: 50 ÷ 4 = 12.5
- Maximum: 20
- Minimum: 5
These functions are very useful in Data Analysis, AI, and Robotics for analyzing sensor values, marks, or any numerical data quickly.
7. Random Numbers
import numpy as np

arr = np.random.rand(3)
print(arr)
np.random.rand(3) → Creates an array with 3 random decimal numbers.
The numbers are between 0 and 1.
print(arr) → Displays the random values.
[0.23 0.78 0.51]
Pandas
Pandas is a Python library used for data handling and data analysis. It is mainly used in Data Science, AI, Machine Learning, and Robotics projects to work with tables of data like Excel sheets.
In simple words, Pandas helps Python read, organize, and analyze data easily.
Main Data Structures in Pandas
1. Series
A one-dimensional array (like a single column).
import pandas as pd

data = [10, 20, 30]
s = pd.Series(data)
print(s)
import pandas as pd → Imports the Pandas library with short name pd.
data = [10, 20, 30] → A normal Python list.
pd.Series(data) → Converts the list into a Pandas Series.
print(s) → Displays the Series.
0    10
1    20
2    30
dtype: int64
Understanding the Output
- 0, 1, 2 → These are index numbers (row labels).
- 10, 20, 30 → Actual data values.
- dtype: int64 → Data type of values (integer).
2. DataFrame
A two-dimensional table (rows and columns like Excel).
import pandas as pd

data = {
    "Name": ["Aman", "Riya", "John"],
    "Marks": [80, 75, 90]
}

df = pd.DataFrame(data)
print(df)
import pandas as pd → Imports the Pandas library.
data = { ... } → A dictionary containing columns.
"Name"→ Column 1"Marks"→ Column 2
pd.DataFrame(data) → Converts the dictionary into a DataFrame (table).
print(df) → Displays the table.
   Name  Marks
0  Aman     80
1  Riya     75
2  John     90
Common Pandas Functions
1. Read CSV File
df = pd.read_csv("data.csv")
pd.read_csv("data.csv")
- Reads a CSV file (Excel-like file) into a DataFrame.
"data.csv"is the file name.dfis the variable where data is stored.
2.Show First Rows
print(df.head())
- Shows the first 5 rows of the dataset.
- Useful to quickly check how the data looks.
Example Output
   Name  Marks
0  Aman     80
1  Riya     75
2  John     90
3.Show Last Rows
print(df.tail())
Shows the last 5 rows of the dataset. Useful to check the ending records.
4. Information About Data
print(df.info())Gives information about the dataset, such as:
- Number of rows
- Column names
- Data types (int, float, object)
- Null (missing) values
5. Statistical Summary
print(df.describe())Shows statistical summary of numeric columns:
- Count
- Mean (Average)
- Standard Deviation
- Minimum value
- Maximum value
SciPy
SciPy is a Python library used for scientific and mathematical calculations. It works along with NumPy and is mainly used in engineering, data science, AI, and research work.
What SciPy is Used For
- Advanced Mathematics
- Optimization problems
- Statistics
- Signal Processing
- Linear Algebra
- Integration & Differentiation
- Image Processing
Important Modules in SciPy
scipy.linalg→ Linear Algebrascipy.stats→ Statisticsscipy.optimize→ Optimizationscipy.integrate→ Integrationscipy.signal→ Signal Processing
1. scipy.linalg
import numpy as np
from scipy import linalg

A = np.array([[1, 2], [3, 4]])
inv_A = linalg.inv(A)
print(inv_A)